|
The D&D Daily's 2016 ORC Report
Publicly Reported ORC Cases & Suspects
Hit All-Time High
Publicly reported ORC cases in 2016 were up 7.4% at 1,590 cases, with
the number of suspects up 4.3% at 3,682 suspects arrested.
| Year |
# of Cases |
$ Amount Reported |
# of Suspects |
| 2012 |
515 |
$146,082,301 |
1,865 |
| 2013 |
893 |
$301,839,481 |
3,149 |
| 2014* |
1,200 |
$681,802,614 |
3,235 |
| 2015* |
1,480 |
$515,088,741 |
3,528 |
| 2016* |
1,590 |
$314,285,830 |
3,682 |
*Dollar Amount Reported Variances Explained
Of special note is that we reported three cases in 2014 and 2015 that totaled
over $700 million, which elevated the total dollar amounts reported.
In 2016, a suspect from a 2014 $200M case was sentenced and the dollar amount was
not included in the total dollars reported. This explains the wide variance for
2016.
From the May 14, 2014 Daily:
$200M credit card fraud case
From the June 20, 2014 Daily:
$200M credit card scheme
From the Jan. 16, 2015 Daily:
$325M international counterfeit smuggling case
From the Jan. 8, 2016 Daily:
Leader $200M Credit Card Fraud Scam Sentenced To 80 Months In Prison - Case
initially reported on May 14, 2014 - not included in $ Amount Reported column.
Analysis: Are we getting better at fighting ORC?
Yes We
Are – But There’s A Caveat
Non-Reporting - Reduced Reporting &
New Laws
Take Time to Show Up in the News
Over the last ten years,
using Albuquerque’s first association roll-out date as a starting date, the
retail Loss Prevention community along with the public law enforcement
communities, pioneered one of the largest public-private collaborative efforts
in the nation’s history.
With over 47 ORC Associations bringing
together over 15,000 investigators it would appear that we’re now identifying
them earlier, catching them faster, and arresting more of them.
Given that these numbers only reflect those cases that are publicly
reported, it does not reflect the full magnitude of the nation's ORC problem. With
corporate media sensitivity and fewer reporters reporting it
due to the newspaper industry’s contraction, especially over the last five
years, these numbers are actually more significant then they appear at
first glance.
Especially given the
NRF’s 2016 ORC Study and
The 2016 National Retail Security Survey both showing that ORC is now the
leading cause of shrink.
With 100% of the retail industry being
victimized, upper management understanding the severity, and staffing at an
all-time high, it would appear from these numbers that, yes, we are getting better
at fighting the ORC epidemic.
However, these numbers don’t include cyber
crime’s impact as we’re still operating under the ORC definition of ten years
ago.
More importantly, as stated above, it also doesn’t include
the vast majority of cases retailers aren’t reporting and the media’s not
reporting due to staff reductions.
Additionally, we could also
be seeing that there’s a core group of reporters in the nation that are
reporting it due to the increased state statutes. With that said, it’ll take time
as well to see the impact from the most recent seven state passages over the
last two years if, indeed, there are reporters out there to even report it.
So while it appears we’re getting better at fighting it, the industry
must remain vigilant and focused on the effort while at the same time the
industry deserves recognition for all of the tireless efforts and thousands of
hours so many have invested.
The bottom line is that
the associations are working and the retailers' investments are paying off.
However, using the publicly reported cases is an inexact science and
without centralized reporting we must rely on the subject matter expertise of
the retail Loss Prevention industry and each retailer's team leaders who live, eat
and breathe ORC.
Editor's Note: In collecting and
publishing these cases and in tabulating these results, we strive to ensure the
accuracy and content of each case as it relates to its respective category of
theft and collecting as much data as we can from the articles themselves.
However, as a publisher, we're not data scientists and at the end of the day
we're relegated to whatever is published.
Certainly, there are those
cases that we do follow up on with the respective authorities and attempt to
collect even more data. But there are limitations to our resources that may
impact these numbers. So we are not responsible for the accuracy or details of
any reported case.
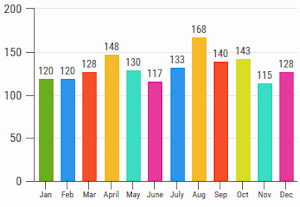
2016 Monthly & Quarterly Analysis
The third quarter and specifically August are the most active quarter and month
of the year.
Certainly the back half was also the most active, despite
November being lightest month, possibly reflecting how the Thanksgiving holiday
might, in fact, be impacting reduced activity.
2016 ORC Cases by
Month
 |
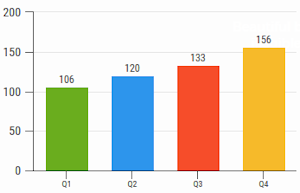
2016 ORC Cases by Quarter
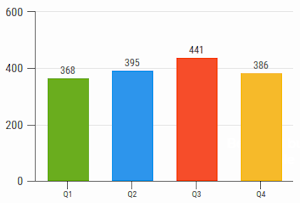 |
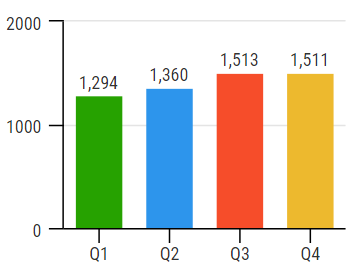
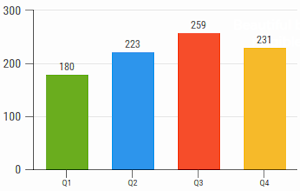
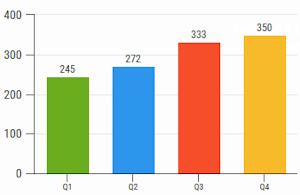
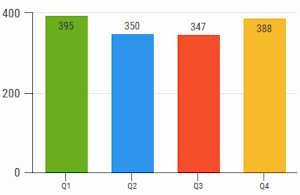
Five Year Quarterly Analysis
Obviously the back half of the year, the third and fourth quarter, are the
busiest time of year for ORC. Interestingly, showing the same trends as consumer
shopping.
5-Year Trend
2012-2016
 |
2012
 |
2013
 |
2014
 |
2015
 |
2016
|
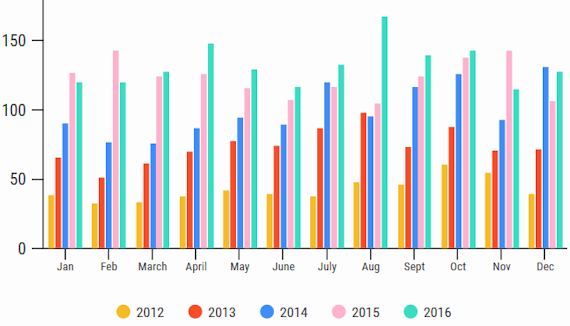
Five-year, month-by-month breakdown
Eight out of 12 months last year saw a higher number of cases when
compared to monthly data over the past five years, as the graph below
shows.
ORC Cases By Month (2012-2016)
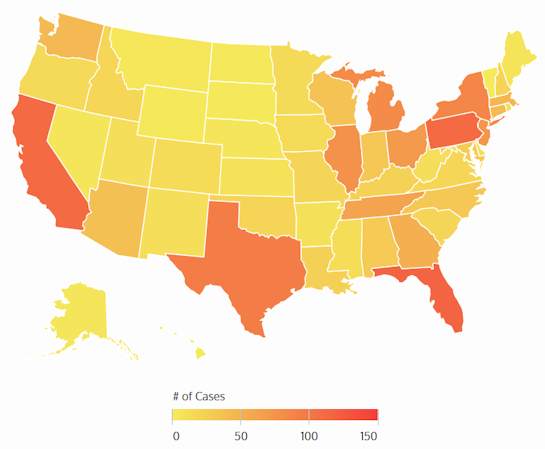
ORC Cases by State
The map below shows which states were
the hottest ORC spots last year, according to publicly reported data in 2016.
The five states with the highest number of ORC cases in 2016 were:
1.
Florida (116)
2. California (112)
3. Pennsylvania (111)
4. Texas (96)
5.
New York (88)
Below are the top 5 states by year from 2012-2015
2012
1. Florida (63)
2. California (60)
3. Texas (52)
4. Pennsylvania (45)
5. New
York (38) |
2013
1. Florida (102)
2. Pennsylvania (81)
3. Texas (65)
4. California (61)
5. New
York (41) |
2014
1. Florida (142)
2. Pennsylvania (89)
3. California (87)
4. New York (76)
5.
Texas (74) |
2015
1. Florida (116)
2. Pennsylvania (76)
3. Texas (75)
4. California (73)
5. New
York (65) |
There is an obvious correlation between state
population and the number of ORC cases reported, as the states topping
the list are among the most populous in the country. This same pattern can be
seen with shopping trends,
as we reported in the Daily on Feb. 21.
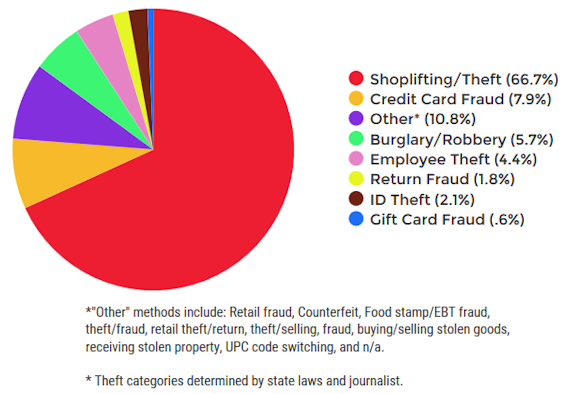
ORC By Method
The most popular method used was shoplifting/theft, which represented
roughly 67% of all cases last year. The chart below shows this and
other various methods used in ORC cases reported in 2016.
Average Case Value
| Year |
Average $ Amount |
% Change |
| 2012 |
$283,655 |
n/a |
| 2013 |
$338,006 |
up 19% over '12 |
| 2014 |
$231,031* |
down 31% over '13 |
| 2015 |
$128,438* |
down 44% over '14 |
| 2016 |
$71,877* |
down 44% over '15 |
| 2012-2016 |
down 75% overall since 2012 |
*Referring to the four large cases mentioned at the beginning of this report,
we have subtracted them from the average case value in the chart to provide a
more accurate measure of the average case value per year.
ORC Suspects By Gender
Of 2016's 3,682 reported suspects, 1,687 were male (62.6%)
and 1,006 were
female (37.4%). The remaining 989 had no reported gender.
The chart below shows a
five-year breakdown. Since 2012, the gender involvement remains consistent.
| Year |
% of Male |
% of Female |
| 2012 |
61.4% |
38.6% |
| 2013 |
59.4% |
40.6% |
| 2014 |
62.7% |
37.3% |
| 2015 |
62.7% |
37.3% |
| 2016 |
62.6% |
37.4% |
|
Top Five ORC Cases of 2016
Of the hundreds of incidents reported in 2016, the highest dollar cases
involved everything from credit card cybercrime to theft. Below are the the top
five cases (by dollar amount) reported
in the Daily last year:
Jan. 8, 2016
Leader Of International, $200M Credit Card Fraud Scam Sentenced To 80 Months In
Prison
July 21, 2016
Man admits running $9M global credit card cybercrime ring
August 1, 2016
Six member fraud gang busted for $9M scheme - Hit Home Depot &
Target Stores
Oct. 25,
2016
Miami, FL: Five charged in theft of 23,000 Apple iPhones valued at over $7
million
June 17, 2016
Westwood, CA: 9 charged with robbing 10 jewelry stores of $6 million in designer
loot
Methodology: The Daily
collects this retail store specific information from public news media
sources throughout the United States and reports it daily in our Retail
Crime column. We do not survey any retailers or third parties nor collect
information from any retail executive. All of this information is available
through public news media outlets. We do not claim nor does it represent all
such incidents or deaths that may occur in retail locations or retail
corporate facilities as many may not be reported in the news media depending
on a number of variables outside of our control. We are not responsible for
the acccuracy of the information reported in the various news media outlets.
We do not name any retailer, retail executive, suspect, or victim.
Copyright: We reserve the rights to this industry exclusive
report and do not authorize its republication or reproduction without
written consent which may include a fee. By re-publishing or reproducing
this report or any parts of it without authorization the party agrees to pay
a fee determined by the D&D Daily.
|